costmap_2d
First off this system is based on the work of Eitan Marder-Eppstein (The Office Marathon: Robust Navigation in an Indoor Office Environment).
Voxel Grid
"A voxel represents a value on a regular grid in three-dimensional space."
Each cell has 3 states (this is not a probabilistic system as this can be computationally intensive)
- Occupied
- Free
- Unknown
Two operations can be done on the grid.
- Marking: Simply changing the status of an element on the grid.
- Clearing: Ray trace from the sensor outwords to see if an obstacle is no longer needed in the cost map.
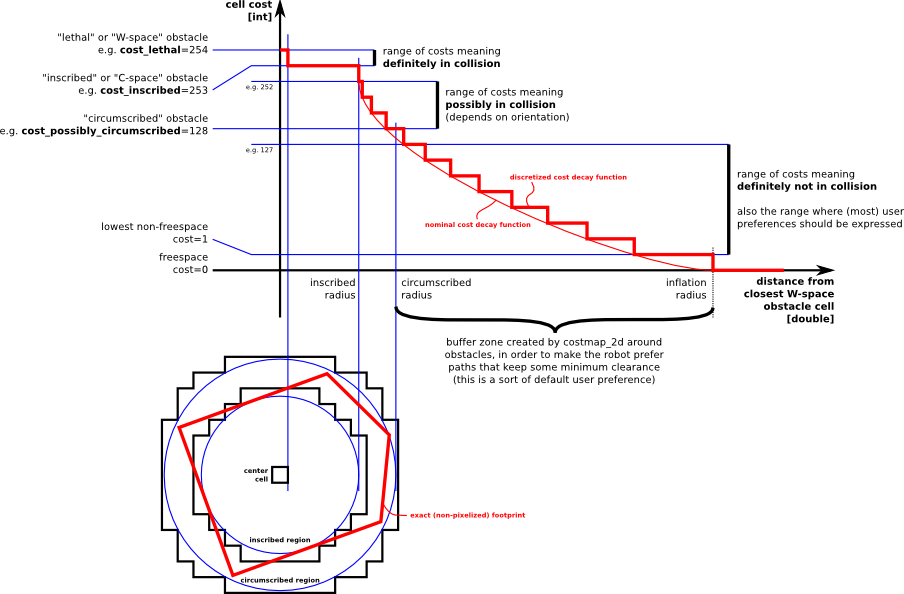
Inflation
This is the 255 different cost values that can be given to a cell.
These break down into 5 distinct levels other than the 3 listed above.
- Lethal: We know there is an obstacle in that cell.
- Inscribed: The cell is in the radius of the robot, so it is in collision.
- Possibly circumscribed: Same as inscribed but using a circumscribed circle drawn around the robot. This does not mean there is a collision for sure is depends on the ratio of the actual robot footprint to the circumscribed radius. The lower that ratio the more likely there is a collision.
- Freespace: We know this cell to be zero and therefor no obstacle.
- Unknown: There is no data on this cell, user assume it be an obstacle or free space.
RANSAC
This is an algorithm that is used to detect outliers and can be used for many things for example localization or cleaning lidar sensor data to remove noise. The algorithm is probabilistic and iterative so the more iterations that a run the better it will do.
RANSAC is a learning algorithm and works by voting and a few other things.
Example with 2D points in a plane to fit to a line.
- Lets look all the points and take a random sample of some size you give and call it the testing set.
- From this sample lets take two points and use a line function to find the line of them.
- Now lets test each point against this line and see who fits on the line or is in some distance from it that we stated is good.
- Keep doing this some number of given time or until no better fit is found.
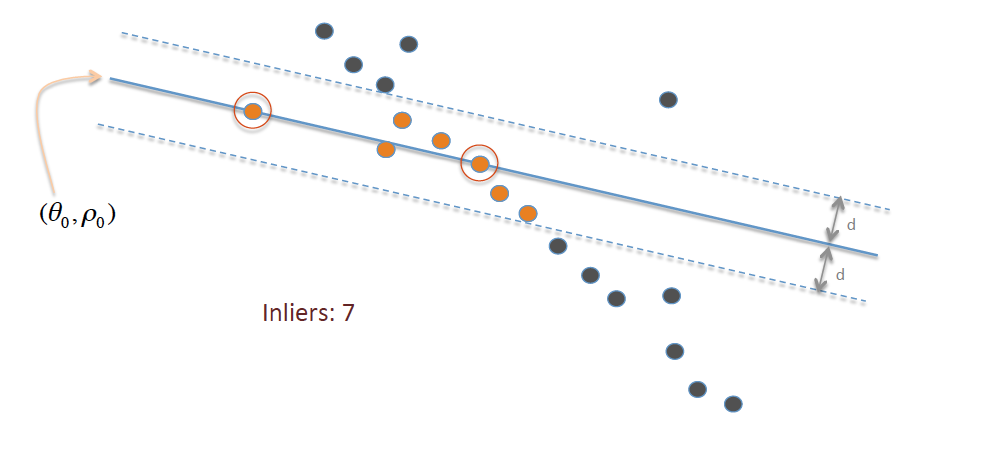
Basically we tell the computer we want as many points to be with in some distance of a line that is the connection of two points in our data. It selects a line at random and then counts how many points are that distance form then the line. Keeps a best guess and tries again until all possibilities are tested or until the number of tries are exceeded.